Study Area
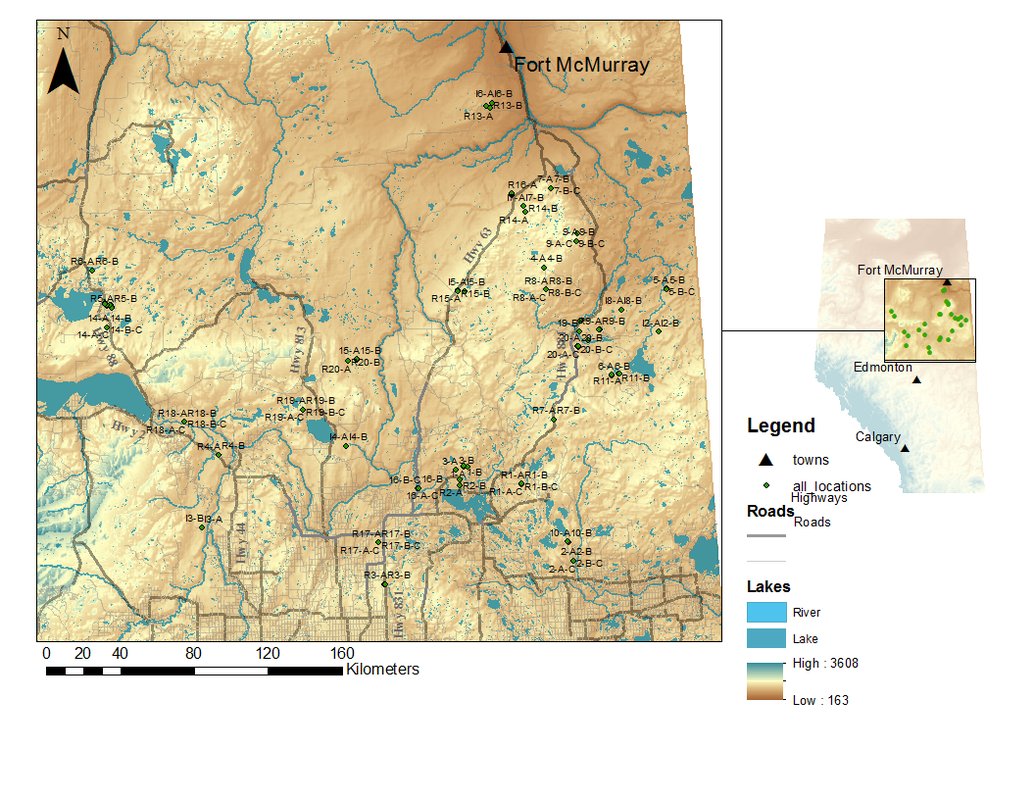
Figure 9. Map of the Study Area
Site Selection
Site selection was performed in ArcMap. Satellite imagery was visually scanned and all the bogs, swamps and fens with road fragmentation in the study area were pooled and stratified using the Ducks Unlimited Enhanced Wetland Classification (DU-EWC). Wetlands were further stratified into course and fine texture geology types using the Alberta Geological Survey 2012 and weather they were at a head water (having no other wetlands or water sources feeding into them) or below head water (having one or more wetlands or streams feeding into it). Wetlands were randomly selected from the stratified pools for survey.
Site: plots within each wetland
In the centre of the wetland two plots were placed adjacent to the road excluding the cleared ditch and to plots were placed 100 meters from the road. This was done for for every wetland.
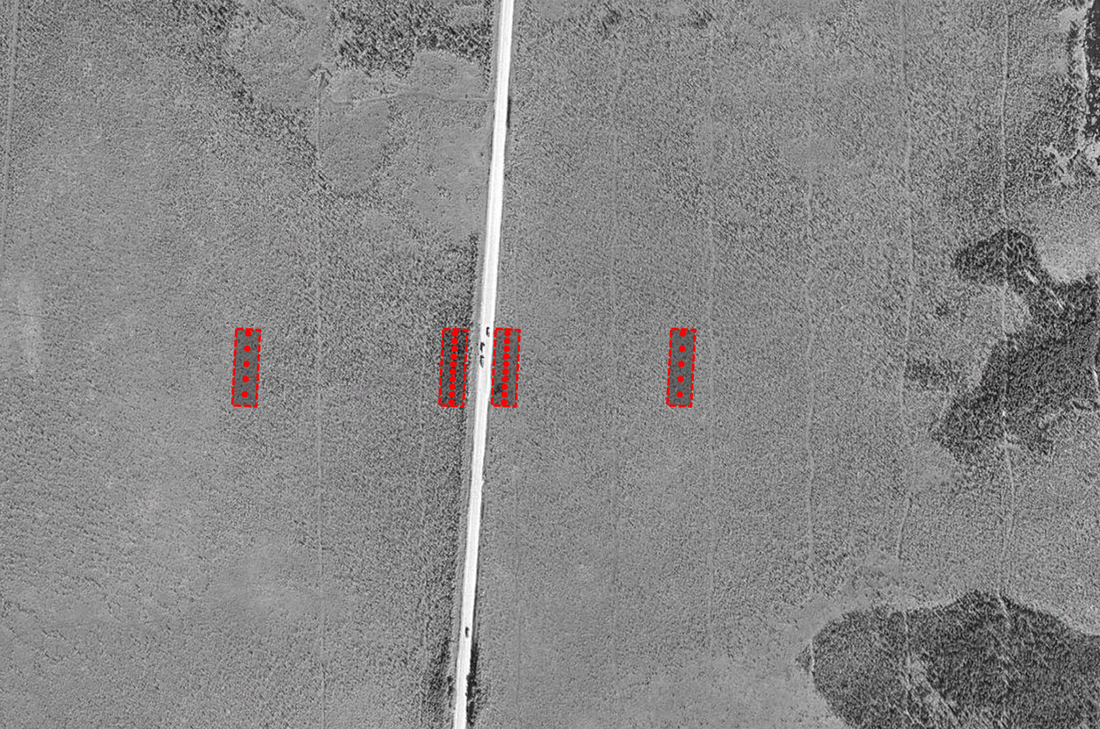
Figure 10. Google Earth 7.1.7.2606 (April 2016) Site R9 in Conklin. Example of paired plot design.
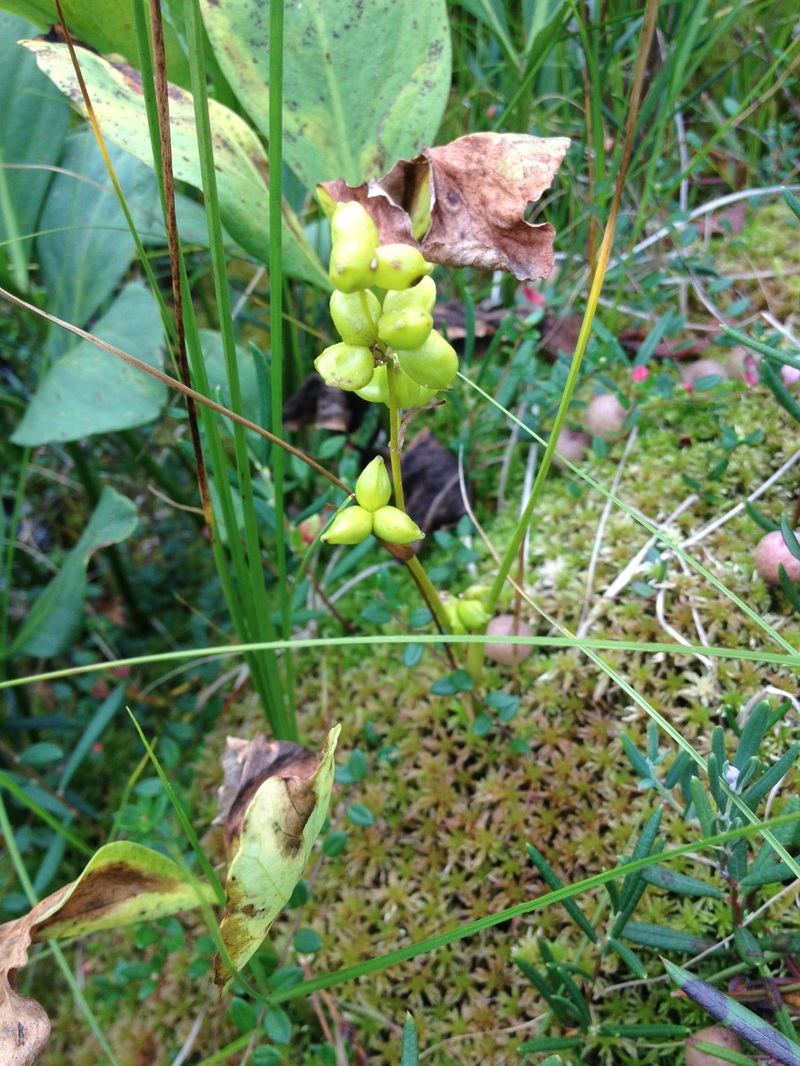
Vegetation Sampling
|
This design is nested, a 50 meter transect is placed through the middle of the plot. The following variables are recorded/measured along the transect: vegetation and canopy cover is surveyed. Every 2.5 m along the transect a 1 meter squared circular quadrat is used to delineate the smallest sub-plot size. Within that quadrat all vascular plants are identified and the foliar cover estimated for each species with total cover estimated for moss and lichen cover. Canopy cover is measured in the center of each 1 m quadrat using 4 densitometer readings in each ordinal direction. In total there are ten 1 m quadrats on the transect line spaced 5 m apart starting at 2.5 m.
The smaller 1 m quadrat are nested within a 1000 meter squared plot, which is the entire length of the transect (50 m) and extend out 10 m meters on one side of the transect line. All the vegetation is identified, however, cover is not estimated but rather presence/absence is recorded. This plot is surveyed by walking belts transects. See Figure 11 below. |
|
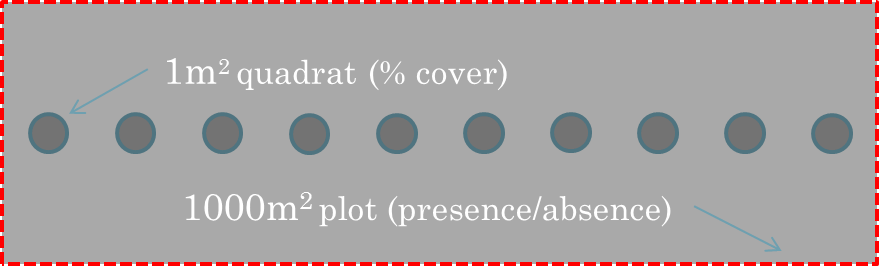
Figure 11. Example of the vegetation plots and quadrats
Chemical Analysis
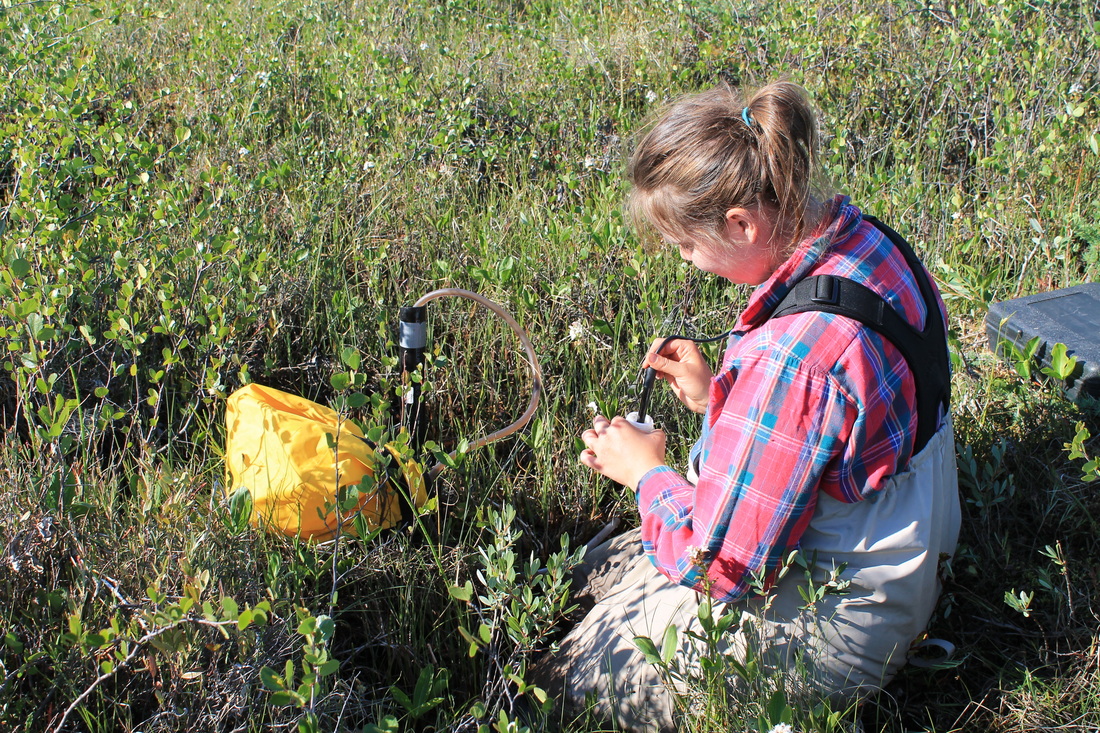
Figure 12. Water sampling in the field
|
In the centre of each plot a piezometer was inserted 30cm into the ground. a siphon was used to sample the water from the piezometer. The water samples were collected in acid washed polyethylene bottles and sent to the University of Alberta Biogeochemical Analytical Services Laboratory (BASL). During the same sampling period, specific conductance and pH will be measured in the field with handheld electric meters. Water samples will be analyzed for elemental contents of Ca, Mg, Na, K, and Fe.
|
Surficial Geology
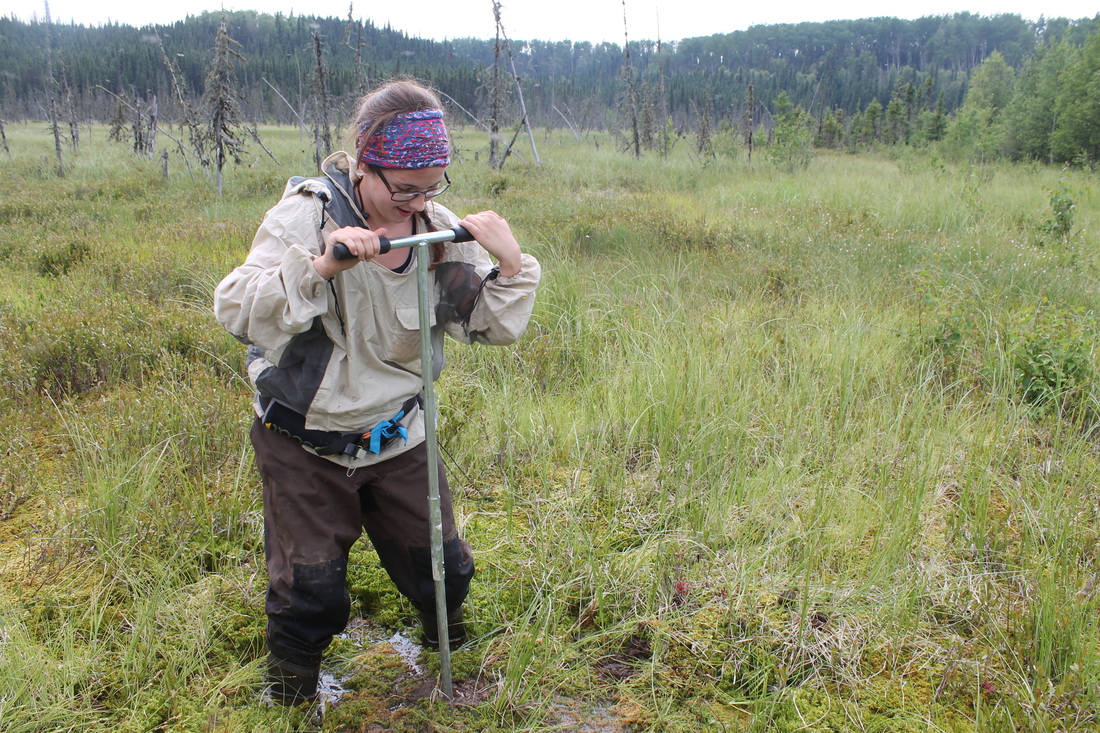
Figure 13. Coring for substrate samples
Using an extendable soil auger a sample of the substrate below the peat was collected from the centre of each site. Sample were sent to the University of Alberta Natural Resources Analytical Laboratory for particle size analysis, which is reported as percent sand, silt and clay.
|
|
|
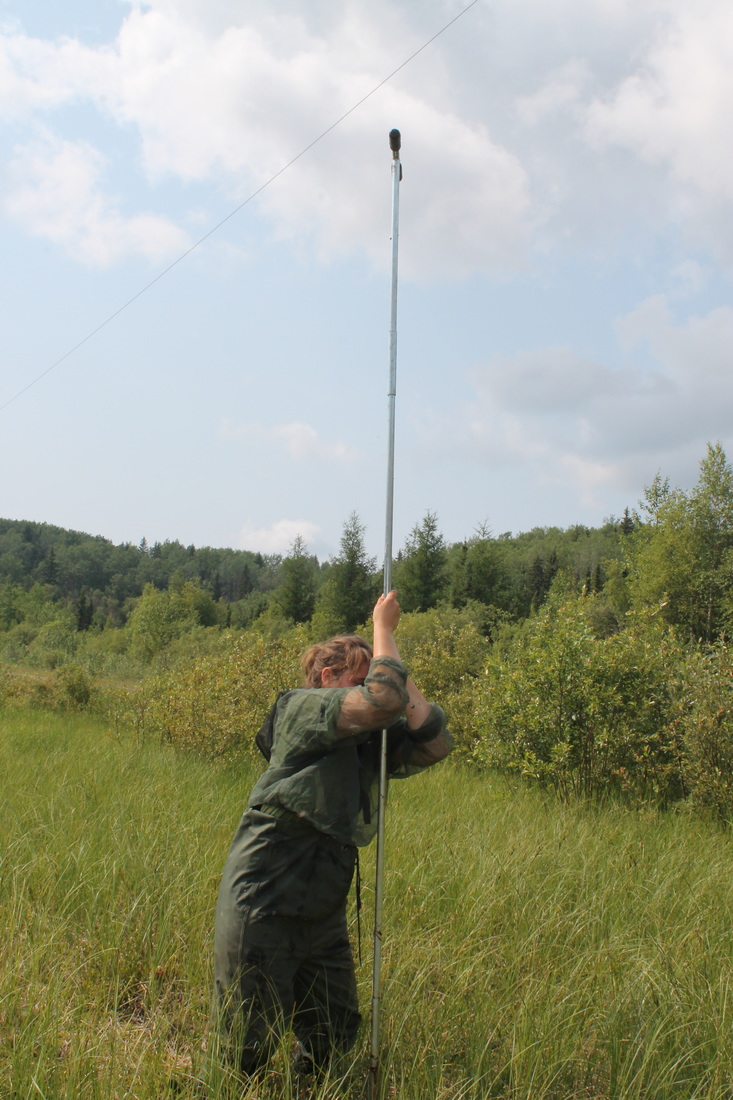
Figure 14. Coring for substrate samples in deep peat
|
Depth to Water Table
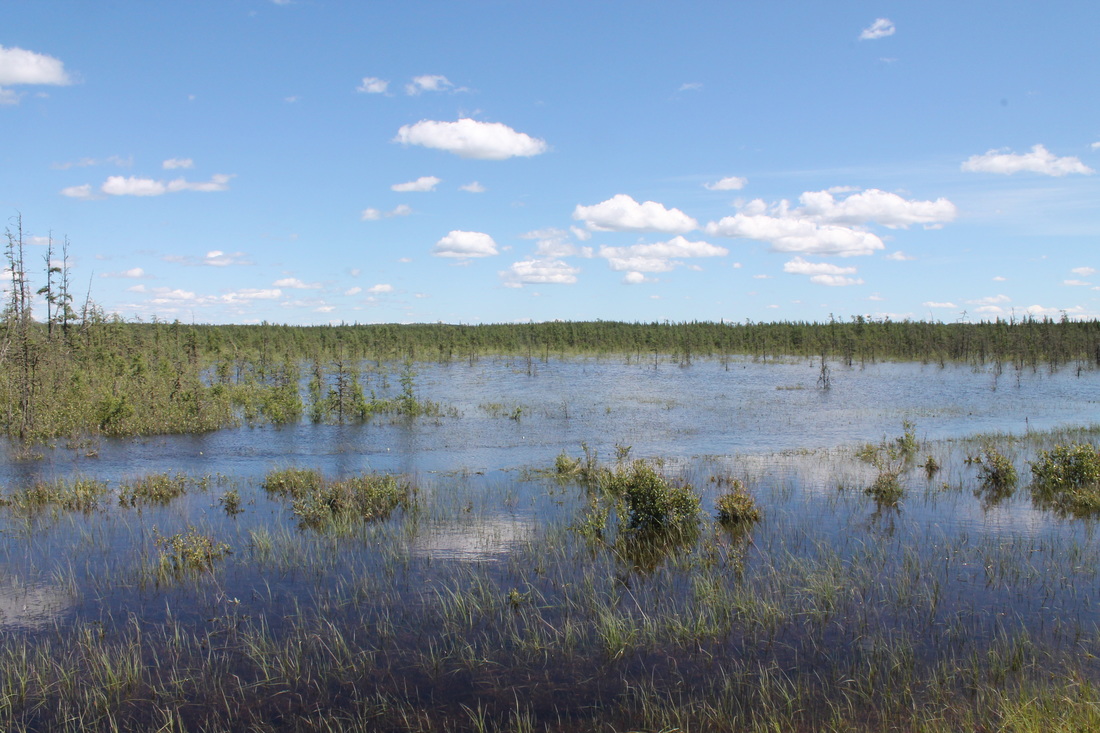
Figure 15. flooded wetland
|
In the centre of every plot depth to water was recorded with the peat/ground surface as zero.
|
Statistical Analysis
Individual quadrates within the same plot were consolidated by using the mean percent cover for each species per plot. A dissimilarity matrix was calculated using a Bray-Curtis coefficient and the abundance data was transformed by adding a constant of 0.001 to eliminate the large number of zeros in the matrix. I created non-metric multidimensional scaling (NMDS) ordinations to visualize the multivariate spread and assess the community distribution. A NMDS uses the community dissimilarity matrix and finds a configuration for it within a given number of dimensions that preserves the rank-order (ecodist package). I created a 1 dimensional NMDS and a 2 dimensional NMDS.
To assess the effect of the road on the vegetation communities, I tested the matrix with a permutational multivariate analysis of variance (Permanova) to see if there were significant differences among treatments. The treatment I tested was side (plots upstream or plots downstream) and distance to road (plots near {0m} and plots far {100m}). To perform the Permanova I used the adonis function of the r package vegan. The adonis function tests the variance using the species distance matrix and is a permutational test so the data does not have to be normally distributed but the test assumes similar multivariate spread among groups. The NMDS plots showed uneven spread among wetland types and habitat type appears to be a major explanatory variable for community composition, I choose to perform the Permanova on partitioned matrixes. The partitioned matrixes were types: Bog, Fen and Swamp. I then tested the matrix with a pairwise Permanova to see which of the plot treatments are significant. For the pairwise comparison I adjusted the p-values with bonferroni correction.
To determine the influential variables on the forested wetland communities, I created models of the multivariate analysis of variance using a distance based redundancy analysis (db-RDA) again using a Bray-Curtis distance with the capscale function of vegan. The db-RDA models of each variable were used to calculate the proportion of variance in the dissimilarity matrix explained environmental measures. A global db-RDA model was create with all environmental variables (with the exception of silt because the soil variables were colinear) to assess the most influential variables on community compostion. The model fit was examined by testing the global db-RDA with an analysis of variance (ANOVA). The global db-RDA was plotted and the correlations for each axes was calculated for the continuous variables. I also created a global db-RDA model with a random effect for site to futher examine the difference in plots and the effect of environmental variables. The randome effect was done by adding "site" as a conditioning variable to the capscale funtion. The statistical analysis was performed using R version 3.3.2 (2016-10-31) -- "Sincere Pumpkin Patch".
