Relationships beween vegetation community assemblages and roads in three different forested wetlands
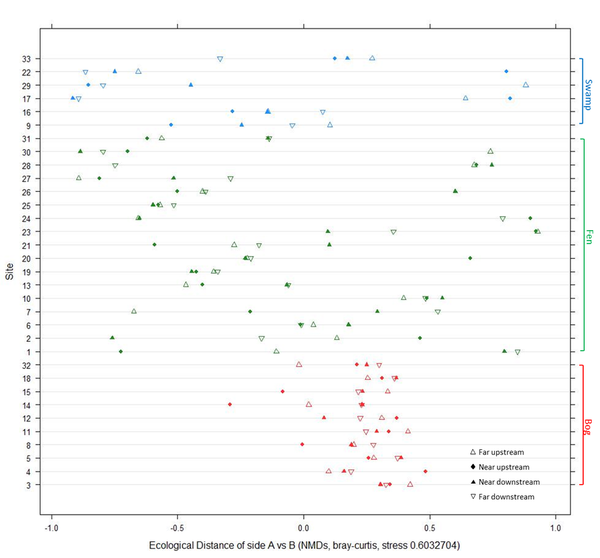
For the species matrix 167 species were include species that were found at only site were removed from the analysis. A one dimensional NMDS was created to visualize relationships between plots and sites (Figure 24). Colours represent wetland type and the shapes are based on plot location. The 1D NMDS had a stress of 0.63 and shows little trends in plot position.
|
The 1D NMDS does a strong relationship between type of wetland and ecological distance between plots.
Additionally, I created a two dimensional NMDS which had a stress of 0.29. Figure 25 shows the NMDS with vectors for environmental variables and ellipses for side. The upstream and downstream ellipses are overlapping and do not appear have distinct community compositions. The 2D NMDS is displayed again in figure 26, this time highlighting different wetland types. The ecological spread in types bog, swamp and fen are very different. Again as demonstrated in the 1D NMDS the bog plots are mores similar in composition regardless to side of road than either swamp or fen. |
Figure 24. NMDs plots showing in one site per line.
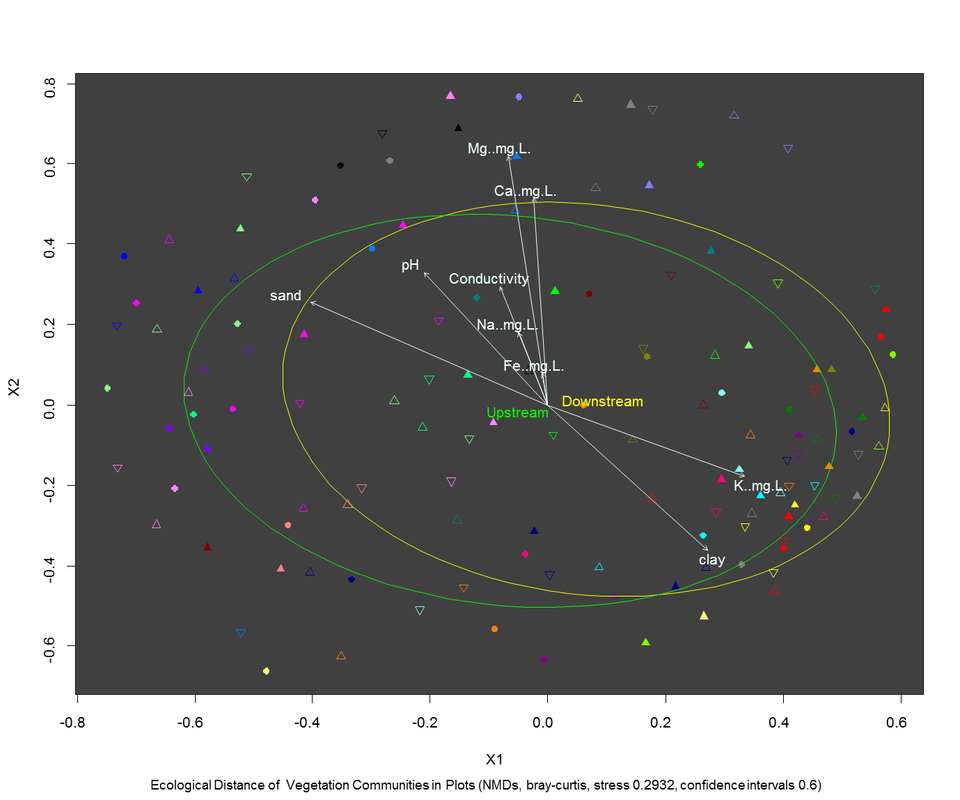
Figure 25. NMDS with two dimentions.
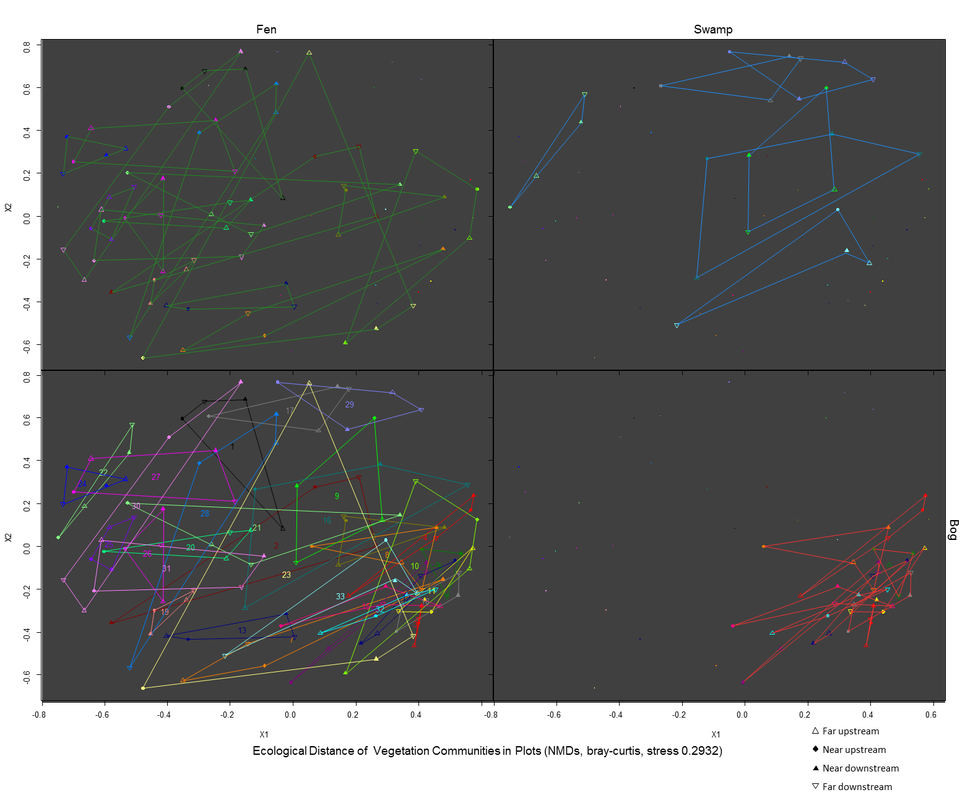
Figure 26. The same NMDs plotted in figure 25. This plot shows the community relationships between plots and type.
Analysing differences in upstream and downstream community composition
A Permanova analysis indicated a significant (p<0.05) difference between the vegetation communities on the upstream side and the downstream side of the road (adonis R^2=0.018, p value of 0.026) which suggest that the two sides of the road may be different. Near and far groups showed no significant results and neither did the interaction of near and far by side. Results shown in table 2.
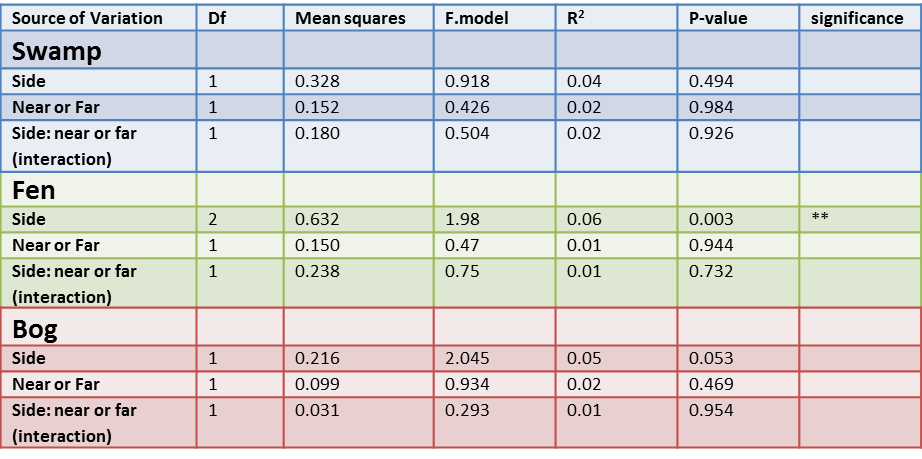
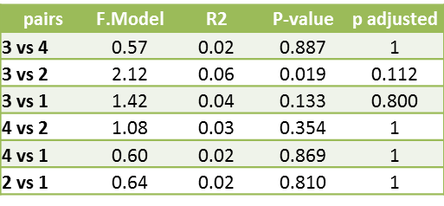
A Permanova on the wetlands types separately revealed a significant (p<0.001) difference in side in fen types (adonis R^2=0.06, p value of 0.003). Additionally a pairwise Permanova was performed on plot within fen type however no significant difference was demonstrated between plots. See results in tables 3 and 4.
A Permanova on the wetlands types separately revealed a significant (p<0.001) difference in side in fen types (adonis R^2=0.06, p value of 0.003). Additionally a pairwise Permanova was performed on plot within fen type however no significant difference was demonstrated between plots. See results in tables 3 and 4.
Table 2. Results for Permanova of entire community matrix. Analyzing variables Side , near and far plots and their interaction.
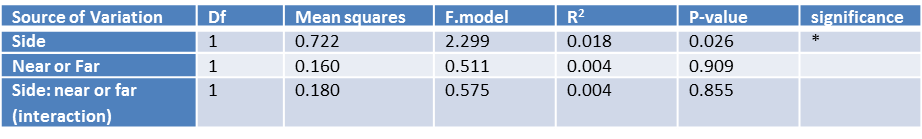
Table 3. Results for wetland type spesific Permanova of entire community matrix. Analyzing variables Side , near and far plots and their interaction.
|
Table 4. Wetland type fen pairwise adonis of plot
|
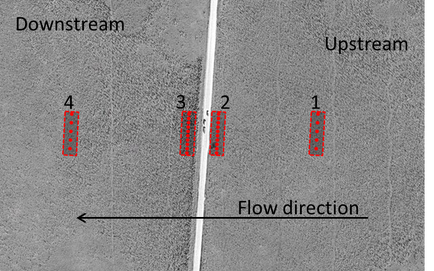
Figure 27. Diagram of plot position in reference to the road and flow direction
|
Finding environmental characteristics that influence the vegetation community compostion
For the individual varaiable db-RDA models, the proportion explained is shown in Table 5. Magnesium, pH and wetland type are the most signifcant variables and explain 3.8%, 1.9% and 19.15% respecively of the variation in the species community matrix. It is also noteworthy that, pH has already been established as a influencial variable in vegetation community composition (Chee & Vitt 1989) and bog, fen and swamp types are conventional classifications based on peatland communtiy studies. These aid in validating the db-RDA models.
The global model was constructed with all the variables (listed in table5). The fit of the overal model was an r^2 adjested of 0.26. An ANOVA on the model revield the p value to be <0.001 . The global db-RDA is shown in figure 28.
The global model was constructed with all the variables (listed in table5). The fit of the overal model was an r^2 adjested of 0.26. An ANOVA on the model revield the p value to be <0.001 . The global db-RDA is shown in figure 28.
|
Table 5. Proportion explained by individual variables for single variable db-RDA models of forested wetland community data.
|
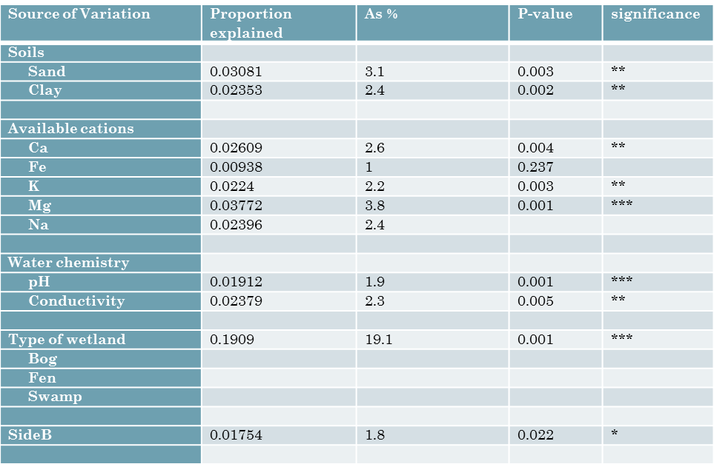
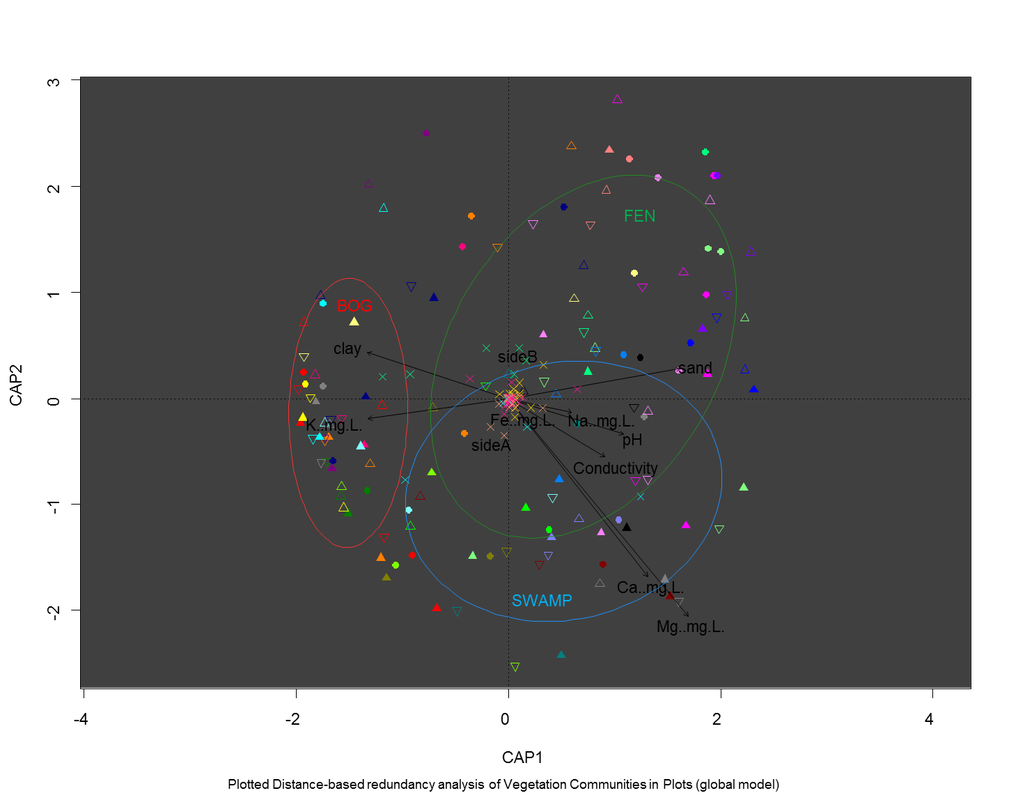
Figure 28. A db-RDA without all the environmental variables. Proportion constrained 0.1713
|
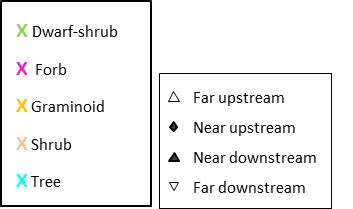
Legend for Figure 28
|
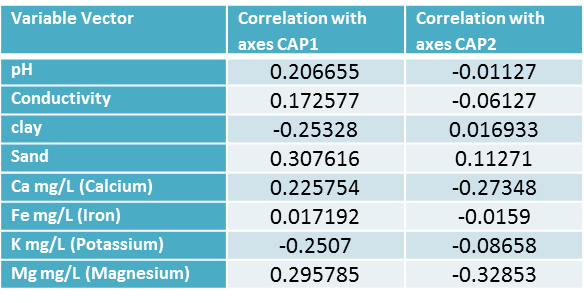
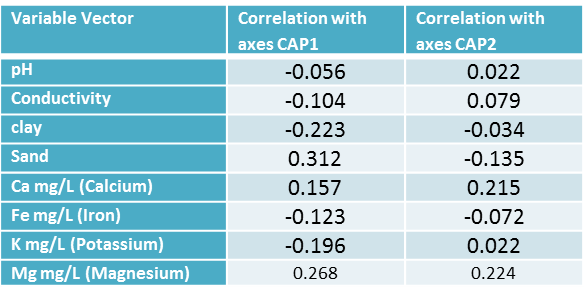
Table 6. shows the correlation each variable vector has which the x (CAP1) and y(CAP2) axes.
|

|
|
The vectors in figure 28 show the showing relationship of the environmental variables to the sites and plots. Table 6 contains the correlations for each axis and the vectors of continuous variables in the plot. We see a strong correlation with soil type and the CAP1 axis with sand's correlation being 0.307616 and clay being -0.25328. The CAP2 axis is most strongly correlated with the variables magnesium -0.32853. As we can see in the plotted db-RDA as well as the NMDS bog is consistently plotting out with lower variation among wetland types.
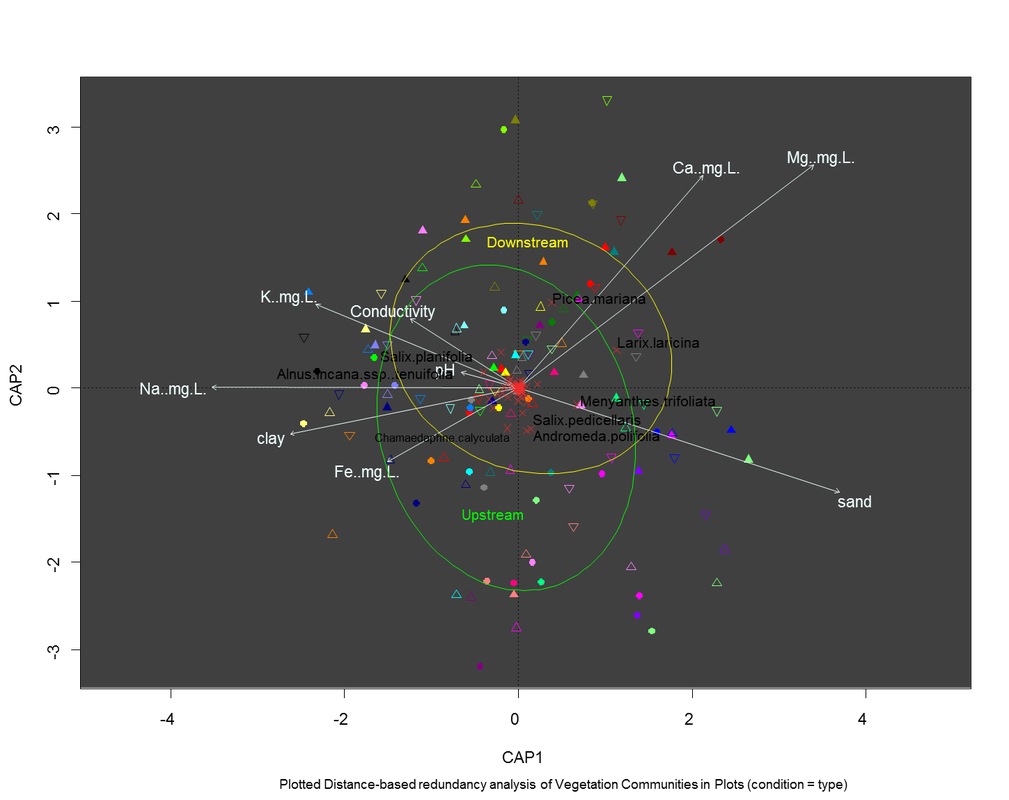
Figure 29. db-RDA with a condition for type. proportion conditioned 0.1687, proportion constrained 0.1177
|
Legend for Figure 29
|
Table 7. shows the correlation each variable vector has which the x (CAP1) and y(CAP2) axes.
|
To control for the variation within wetland type, I used a conditioning statement in the capscale function of vegan. I did this to remove some of the understood variation in the species community matrix. The results of the global db-RDA with condition type is an r^2 adjusted of 0.127. An ANOVA on the model reviled the p value to be <0.001 . The r^2 value suggests that the conditioning statement decreased the amount of variation explained by the model. We also see in the vector correlation (table 7) and in plotted db-RDA (figure 29) that pH is not explaining the axes of the ordination as well. Given that pH seems to explain the similar species compositions that the bog, fen, swamp classification do it isn't surprising that pH is less significant. Sand is still a significant explanatory variable for the ordination axes and may be different components of the species matrix that type is controlling for.
Discussion
In this study I was able to find evidence that Fen wetlands are impacted by roads. I wasn’t able to find support that bogs and swamp are impacted by roads. Based on my prediction for wetland type I hypothesized that fens because of their regional ground water systems and year round water flow would experience the greatest road impacts due to water damning. Similarly bogs were hypothesized to have little to no difference due to the fact that they are generally considered to be stagnant systems primarily fed by rainwater. Upon further investigation into the species compositional differences in plots I found that in fens there was no significant difference in plots. We may need more replicates to have the power to detect differences and it’s possible the “far” plots should have been more than 100m from the road to no longer be influenced.
Given the high complexity of the system and how broad the scale, my environmental variables were able to explain 17.13% of the variation with the global db-RDA without conditions. I found strong relationships between environmental variables such as potassium, calcium and magnesium, and vegetation community composition. The db-RDA with conditions suggested soil composition can also explain species composition in peatlands that is not represented in the DU bog fen swamp classification system.
Further investigation is needed to find relationships between soil composition and road impacts and more research is needed to truly understand the disruption to wetland hydrology caused by roads. Hydrology is arguably the most important process in maintaining wetland ecosystems (Devito and Mendoza 2006) and wetland type can only give a vague and general understanding of the hydraulic process.
My study demonstrates that road compaction and fragmentation of fens which are large hydrologically connected wetland ecosystems influences the forest vegetation composition. Given the growing influence of climate change on our planet, it is expected that warmer, drier conditions will become more prevalent in the coming years. Lower water tables is expected to reduce carbon stores in rich minerotrophic peatlands (Laiho and Laine 1997; Minkkinen et al. 1999; Laiho et al. 2003). This issue is compounded by increases in woody plant composition, drying and proximity to roads which can increase peatland forest fires (Arienti et al. 2009) exacerbating climate change (Oris et al. 2014). As a management prescription, the results of this study indicate that fen peatlands should be avoided during road construction.
